Benford's Law
 by Albert Frank
Introduction
In 1881, the American astronomer Simon Newcomb (Gold Medal of the British Royal Astronomy Society 1874, President of the American Mathematical Society 1897) observed that the earlier pages of logarithmic tables were more worn than later pages. He con-cluded that numbers with low valued leading digits arose more frequently in calculations. This led him to examine how numbers in natural data were distributed and ultimately to propose that the "probability of the occurrence of numbers is such that the mantissa of their logarithms are equally probable". From this he inferred that the distribution of leading digits is such that the probability of the first significant digit being d is equal to log10(1 + 1/d). The probability for the first nonzero digit to be 1 or 2 is nearly .5. This is of course far from intuitive. Newcomb presented no empirical evidence or theoretical proof of this rule. Nobody realized the importance of this discovery.
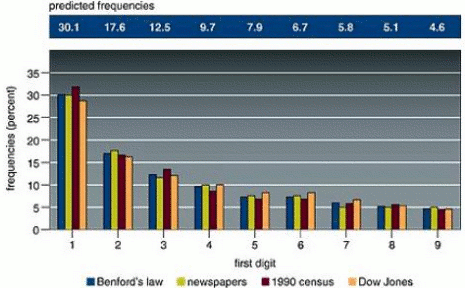
| First digit d | 1 | 2 | 3 | 4 | 5 | 6 | 7 | 8 | 9 |
|---|---|---|---|---|---|---|---|---|---|
| Probability of d | .301 | .176 | .125 | .097 | .079 | .067 | .058 | .051 | .046 |
In 1938, 57 years later, Dr. Frank Albert Benford, a physicist at the General Electric Company, noticed exactly the same thing: pages of logarithms corresponding to numbers starting with the numeral 1 were much dirtier and more worn than other pages. Dr. Benford concluded that it was unlikely that physicists and engineers had some special preference for logarithms starting with 1. He therefore embarked on a mathematical analysis of 20,229 sets of numbers, including such wildly disparate categories as the areas of rivers, baseball statistics, numbers in magazine articles and the street addresses of the first 342 people listed in the book "American Men of Science." All these seemingly unrelated sets of numbers followed the same first-digit probability pattern as the worn pages of logarithm tables suggested. In all cases, the number 1 turned up as the first digit about 30 percent of the time, more often than any other. ("The First-Digit Phenomenon" by T. P. Hill, American Scientist, July-August 1998.).
Benford's law predicts a decreasing frequency of first digits, from 1 through 9. Every entry in data sets developed by Benford for numbers appearing on the front pages of newspapers, by Mark Nigrini of 3,141 county populations in the 1990 U.S. Census and by Eduardo Ley of the Dow Jones Industrial Average from 1990-93 follows Benford's law within 2 percent.
Theoretical Aspect
-
Let's first try to show the nonhomogenous distribution of the first nonzero digit using the numbers of the houses in a street. If there are only 9 houses, all the first digits have of course the same probability. Take now a street with 19 houses. The first digit is 1 in 11 cases out of 19. In a more general way:
The first digits have the same probability only when the number of houses on a street are 9, 99, 999, ... 10n - 1. This is nearly never the case.
The distribution of the first digit is a function of the number of houses. This distribution has to be calculated. It will be named Benford's law.
The lengths of the streets will follow the same law. Out of this, it can be proved that this law is scale invariant, the units used for the measurements have no importance (for example: the area of a lake can be measured in square kilometers or in square miles). This invariance implies a connection between Benford's law and chaos theory.
In 1961 Roger Pinkham, a mathematician then at Rutgers University in New Brunswick, New Jersey said: Just suppose there really is a universal law governing the digits of numbers that describe natural phenomena such as the drainage areas of rivers and the properties of chemicals. Then any such law must work regardless of what units are used. Even the inhabitants of the Planet Zob that measures area in grondekis must find exactly the same distribution of digits in drainage areas as we do, using hectares. But how is this possible, if there are 87,331 hectares to the grondeki?
The answer, said Pinkham, lies in ensuring that the distribution of digits is unaffected by changes of units. Suppose you know the drainage area in hectares for a million different rivers. Translating each of these values into grondekis will change the individual numbers, certainly. But overall, the distribution of numbers would still have the same pattern as before. This is a property known as "scale invariance".
Pinkham showed mathematically that Benford's law is indeed scale-invariant. Crucially, however, he also showed that Benford's law is the only way to distribute digits that has this property. In other words, any "law" of digit frequency with pretensions of universality has no choice but to obey Benford's law.
And so, this law seems to have some common features with relativity!
-
Let's now make an experiment. It is not directly connected with Benford's law, but with the danger of trusting one's intuition. A complete description of it may be seen at: http://users.skynet.be/albert.frank/an_efficient_function.htm.
When one throws five dice, a sequence is 1, 2, 3, 4, 5 or 2, 3, 4, 5, 6. The probability to get a sequence is given by 1/3 F(6; 5) = 5/162 (about .03), where the function, F(b; n) ≡ b! / ( b - n )! bn. It gives the probability of having no repetitions in n samples from a base of b alternatives.
The experiment is to ask several people to throw 5 dice 300 times, and note their results. (Each throw is to be noted in ascending order. If there is a repetition, the repeated number will be noted twice or more (for example: 22556 would be the result from one throw of the five dice). In the tabulation each throw is to be separated by a coma. So we will have 300 5-digit numbers. You also tell the people that they are allowed, if they so desire, to throw no dice and just write 300 random sequences of 5 digits (all the digits in the range 1 to 6).
It will be easy to discriminate most of the people who effectively threw the dice and those who made what they thought to be random choices: In the first case there will be approximately 9 equally-frequent sequences, in the other case there will be much fewer (because in their "random" process they won't want to write 12345 or 23456).
-
The demonstration of Benford's law (and also for the distribution of the second digit) was done in 1996 by Professor Theodore Hill (School of Mathematics, Center for Applied Probability, Georgia Institute of Technology) in his article "A Statistical Derivation of the Significant-Digit law". The article may be seen at: http://www.math.gatech.edu/~hill/publications/cv.dir/stat-der.pdf
Another very complete article was written in 2004: "Discussion on Benford's law and its application," by Li Zhipeng, Cong Lin and Wong Huajia: http://arxiv.org/PS_cache/math/pdf/0408/0408057.pdf
Two other very valuable articles about Benfords' law are:
-
B MANDELBROT. The fractal geometry of nature, Freeman, San Francisco, 1982.
-
B. BUCK, A. MERCHANT & S .PEREZ. An illustration of Benford's first digit law using alpha decay half times in European Journal of Physics, n°14, pp.59-63, 1993.
-
Applications Of The Benford's Law
-
First, let's look at some things
which can't really be called applications, but are observations:
In any big table of numerical measurements involving random
aspects, the distribution of the first nonzero digit is very
accurately described by Benford's law. Before giving examples, I
must add a note here: This law has nothing to do with roulette,
for example, because in casino games like roulette, we can't say
we have numbers per se, but merely symbols (in some Asian
roulette games, there are no numbers but images, the "best" being
a star).
Some examples: The areas of the lakes in the world (expressed in square miles or in square kilometers), the half lives of radioactive elements, the values of a particular stock during a 500 day period, the number of citizens in all towns of a country, the number of kilowatts used by a country in one year, numbers appearing on front pages of newspapers, the physical constants, the numbers in statistical tables, Fibonacci series (they are not random, but still fit), ...
- Tax fraud: The digital analysis technique has been adopted by the world's leading auditing and consulting groups. Tax defrauders hoping to evade detection will find the job difficult, as the second digit obeys a similar though not identical distribution to the first. Benford's law is used in several countries as a method for spotting fraudulent accounting data by looking at the first significant digit of each data entry and comparing the actual frequency of occurrence with the predicted frequency.
- Checking for mistakes in big tables: with financial data or nearly any numerical data. When I was working at the Work Accident Office in Belgium, I used it with the result that mistakes could be found about eight to ten times faster than had been the case before.
- Winning some bets: Even against a lot of mathematicians, it's possible to win bet's like "Let's take a randomly chosen Fibonacci number: Even though the odds of my winning would seem to be only one-in-three, I will give even odds."
My Contribution
In work accidents, it is known worldwide (where Saturday and Sunday are days off from work) that there is a diminution every day, from Monday to Friday. (We don't take Saturday and Sunday into consideration.)
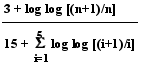
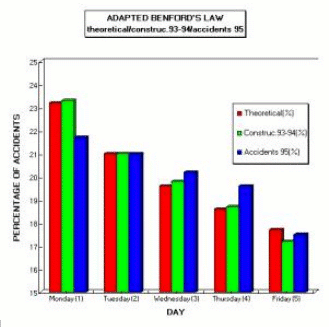
When, I returned from Central Africa in 1996, I began working at the Belgian Office on the statistics of work-related accidents; this intrigued me. Officially, the fact that maximum occurrences were on Mondays was interpreted as individuals trying to declare weekend private accidents as work-related accidents taking place on Monday. This makes sense, but does not explain the diminution in the next days. I tried to understand this by an adaptation of Benford's law. For data, I used the totality of the work-related accidents in the private sector in Belgium in 1995 (about 200,000 accidents), and separately the accidents in the field of construction during the years 1993 and 1994 added together (about 60,000). After a lengthy derivation, I arrived at a formula (giving the Probability for the first digit (i. e., day of occurrence) to be n (in the range 1to 5 -- 1 for Monday, 2 for Tuesday, up to 5 for Friday). The formula is the following, where "log" refers to the logarithm base 10:
The table below shows the theoretical values (in percentages) obtained from this formula, the actual percentages of work-related accidents in 1995, and work-related accidents in construction for 1993 and 1994. This data has been plotted in the graph at the bottom of the page.P(n) =
| Day of Week | Theoretical (%) | Accidents 95 (%) | Construct. 93-94 (%) |
|---|---|---|---|
| Monday (1) | 23.2 | 21.7 | 23.3 |
| Tuesday (2) | 21.0 | 21.0 | 21.0 |
| Wednesday (3) | 19.6 | 20.2 | 19.8 |
| Thursday (4) | 18.6 | 19.6 | 18.7 |
| Friday (5) | 17.7 | 17.5 | 17.2 |
For Tuesdays, the three percentages are in complete agreement. For the other days of the week, the differences are quite small. However, the validity of this adapted law should probably to be studied more deeply.


No comments:
Post a Comment