The President's Impact to Personal Prosperity
[Although the following article was written in 2004 and pertained specifically to the resident of the White House which cannot be resolved in a midterm election, constraints on that office can be imposed by a congress of an opposing party. The projections of this article have proven dismally realistic, and although the stock market is momentarily above its disastrous lows, personal prosperity increasingly languishes. --editor]
A popular subject of discussion during election campaigns is the economy and the effect a prospective President may have on it. Typically -- as now -- a sitting President and his opponent will each claim that he will be better than the other for the economy. When the economy is poor, the administration and it's supporters will often claim that the President either has little effect on the economy, or that a poor economy is the fault of his predecessor, or both. In this campaign we are hearing three claims: The President's plan for improving the economy is working, the President really has little effect on the economy, and the problems with the economy should be blamed on his predecessor. Obviously, these three claims are not mutually compatible.
Which claim (if any) is the truth? A close look at prosperity in relation to workers wages and salaries over the past few decades might be revealing.
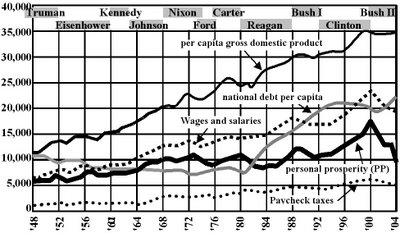
Let us define prosperity as income minus the present expense of taxes and minus the increase in the deficit, and let's also adjust those numbers for inflation and population growth. This will give us an effective comparison of the economy and fiscal responsibility across the various administrations. It will also provide a good tool for estimating how the average American is doing now in real numbers, and where we are going, fiscally speaking.
At this point in the current election cycle, monthly attempts are being made to estimate total wage and salary income by comparing competing unemployment statistics and then interpreting their accuracy and, independently, the quality of jobs (average salary levels). This seems to be an unnecessary diversion. The IRS already compiles workers total wage and salary income data in conjunction with tax collections. We will use this income data in our chart, adjusted to real per capita year 2000 dollars (y2k$).
The primary expenses deducted from our wages are total personal taxes. This is the expense that we will subtract from the income data.
The deficit that we will deduct from our prosperity curve will be the increase in our gross national debt (GND). Though consumer debt is very large (it is currently nearly 30% the size of our GND) and growing in relation to our national debt, it can be seen to be very little effected by Presidential fiscal responsibility.
So our Personal Prosperity (the PP curve with the bold dark line in the chart) is defined as wage and salary income minus paycheck taxes (total IRS receipts minus corporate taxes) and minus the deficit on the national debt, all adjusted per capita to y2k$.
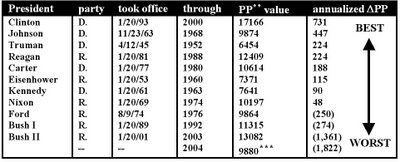
Here are rankings of recent Presidents with regard to Personal Prosperity during their respective terms in office (using the most recent data):References:
Wages and Income: http://www.irs.gov/pub/irs-soi/01in06pa.xls
Consumer Price Index: http://www.bls.gov/cpi/
Tax collections: http://www.irs.gov/pub/irs-soi/98db09co.xls
Gross National Debt: http://www.publicdebt.treas.gov/opd/opdpenny.htm
Gross Domestic Product: http://bea.gov/bea/dn/nipaweb/TableView.asp#Mid
All charts, data, and calculations available at http://www.giftedgeeks.com/economy/
* Lines on chart are limited to editor's graphic tools. Refer to official sites for more accurate data.
** Economic values pertain to end-of-year, and elected presidents are inaugurated in January.
***Unfortunately, I believe that my projection of the remainder of Bush II's term is accurate. It's not looking good.


No comments:
Post a Comment